Making bar graphs in Stata
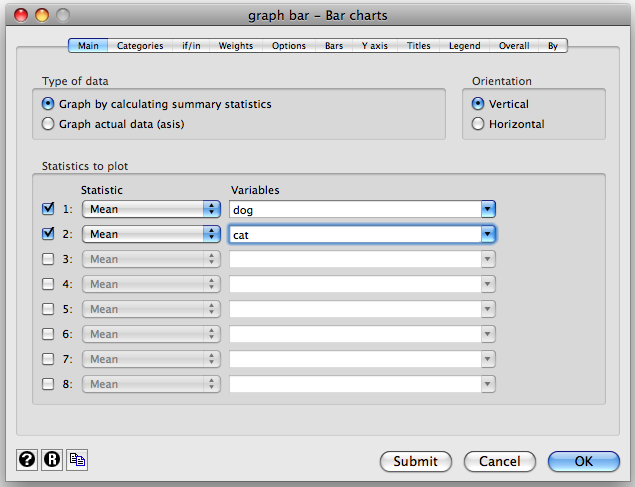
Bar graphs are a useful way to display means (averages) of datasets. Making bar graphs in Stata may be easiest using the menus. Select Graphics on the Mac toolbar and click on Bar chart; this will bring up a window detailing the bar chart options. To include a variable in your graph, check the box next to a field and select the variable you'd like to chart from the field's drop-down menu.
For more on the tabs available to most graphs using the menus, see graph menu tutorial
To make multiple graphs according to a grouping variable, use the By tab.
If you want a bar graph with error bars, the process is somewhat more complicated. For starters, the UCLA Website UCLA Website offers some good resources. Ultimately however, you may find it easier to do this particular graphing in a different program, such as Excel.
Back