Navigating Graph Options
When you use the Graphics menu in Stata to build your graphs, you are set adrift in a bewildering sea of tabs. This tutorial hopes to demystify that strange, fabulous world so that you use it to your advantage. For the purposes of this tutorial, the most basic menu Graphics => Twoway graph will be used. However, the tabs are common to most other graphs too.
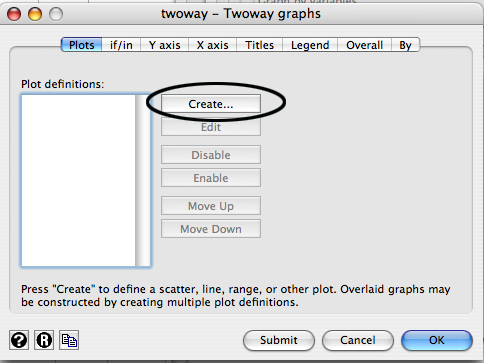
Twoway graph permits you to build any two-way graph. In this instance, lets pretend we want to build a scatterplot-based graph. First click Create
Now, since a scatterplot is the default, you need to select your x and y variables. Below the variables are two marker-related buttons. The first, marker properties, allows you to choose a symbol for the points of the graph and a color and size for that symbol. Below this are options to add labels at each point, which may be useful to you. Check the Add labels to marker box to activate the marker label options. Additional options, such as jittering the markers (staggering them via random spherical noise) which can be useful in cases where points would overlap severely and look like one rather than multiple points otherwise. Select "accept" to close the dialogue.
The next tab is the if/in tab. The If box takes an expression like var>6 which would exclude all cases who which var was less than six. The Use a range of observations checkbox selects cases based on their absolute number. For example 1-10 would only graph the first ten observations.
The Y axis tab contains, unsurprisingly, options pertaining to the y axis. Title determines the title that displays along the y axis. The Properties button next to it allows you to things such as put a box around the title, select a color for the title and choose which way the title text will orient. The Advanced tab has justification options and finicky spacing options as well. The major tick/label properties tab allows you to control the number of major tick marks, minimum and maximum values, their appearance, their color and whether or not they're labeled. You can also choose whether or not to show gridlines. Use Accept to return to the original graph building screen.
Axis line and Axis scale properties are more of the same (but for the axis line and the scale). Reference line allows you to choose specific points at which to draw a line through the graph, like at the mean, and to control the appearance of that line.
These options then repeat for the x-axis (under the X axis tab)
The Titles tab controls titles for the graph. Each title and title type has a Properties button to control the size, color, placement and other such things. If you change your mind, these things are relatively easy to edit after the fact. The Box puts a box around the title and Advanced controls justification and gap between the text.
The Legend tab controls whether or not the legend appears. The two buttons, Organization/Appearance and Placement, control where the legend is located (placement) and how the legend looks (appearance), including giving it titles and subtitles.
Overall controls the overall appearance of the graph. This includes things like the size of the graph, the name of the graph, the scale of the graph and even the aspect ratio of the graph. If you are feeling adventurous, the Region tab controls things like the inner and outer region of the graph.
The last tab is the By tab. By offers you the ability to split your graph into multiple graphs according to some other variable. To activate this option check the Draw subgraphs for unique values of variables box. You can now split the graph by multiple variables. Additionally, a series of checkboxes at the bottom allow you to create additional graphs not split by the specified variable. There are also buttons to control how the family of graphs are displayed and title.
To complete your graph click OK.
Every option you choose will be displayed as a series of arguments in the Results window as well as in the Review window, so you can always use the menu to get a feel for the code and then edit the code directly in the Command window.
Back