Make & Print Histograms
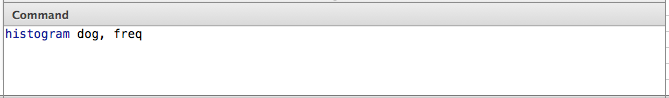
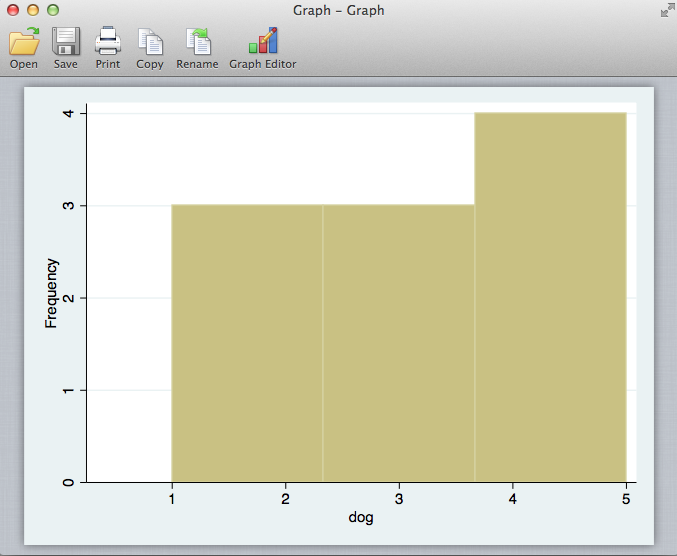
Finally, we're going to make some histograms of the data. The basic command is histogram variable, freq where variable is the name of your variable. First, we make a histogram for dog rating.
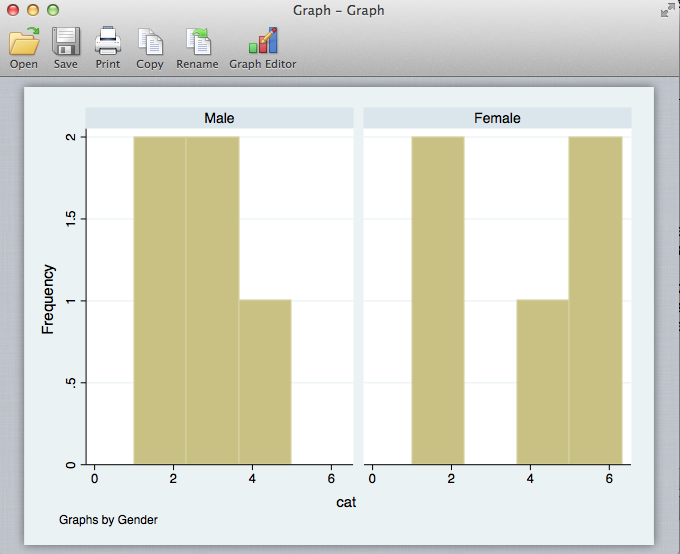
Now, I want to look at how participants rated "cat" split by gender. To do this, I add a by() so the full command is
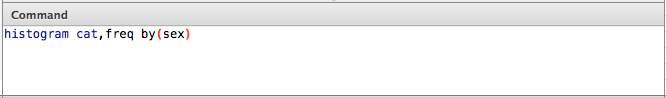
This yields the following graph:
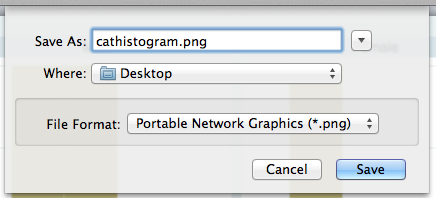
Control-click or right-click on this graph and select "Save As..." Give the histogram a useful name and select .png from the dropdown menu of file formats. You can also click "Save" on the Graph window's toolbar.