Tables & Tabulation in Stata
One of the most useful ways to look at a quick summary of data is by tabulating it. Stata offers a variety of ways to tabulate data.
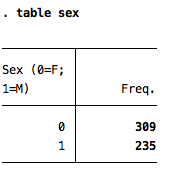
The most basic table, table [variable] , will show the variable and the frequencies of each category, like so. This can also be done with more than one categorical variable, table [variable1] [variable2] [variable 3] [variable etc]. In either case, the default behavior for a table is to display frequency of occurrence.
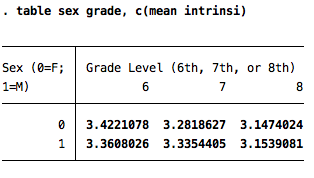
To change the default behavior, you have only to specify what you would like Stata to display instead. For example, to get Stata to do a two-way table with means of a third variable, rather than frequencies you would type table [categorical row variable] [categorical column variable], c(mean [y variable]) so to see how sex and grade level affected reported intrinsic motivation, the command would be table sex grade, c(mean intrinsi) The result of which would look like this:
While mean is a frequent choice, the following other words can be placed in c() and will cause the corresponding item to be tabulated.
mean [variable name] |
mean |
sd [variable name] |
standard deviation |
semean [variable name] |
standard error of the mean (sd/sqrt(n)) |
sebinomial [variable name] |
standard error of the mean, binomial distribution (sqrt(p(1-p)/n)) |
sepoisson [variable name] |
standard error of the mean, Poisson distribution (sqrt(mean)) |
sum [variable name] |
sum |
rawsum [variable name] |
sums ignoring optionally specified weight |
n [variable name] |
count of nonmissing observations |
max [variable name] |
maximums |
min [variable name] |
minimums |
median [variable name] |
medians |
p1 [variable name] |
1st percentile |
p2 [variable name] |
2nd percentile |
p[N] [variable name] |
Nth percentile (where N is between 1 and 99) |
iqr [variable name] |
interquartile range |
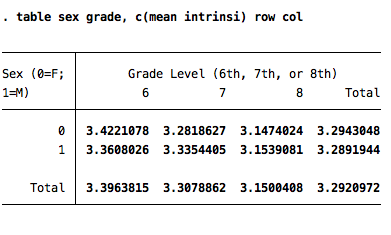
This simple example illustrates the main idea of how to alter the table's contents, but there are a variety of additional options you can use as well. For instance, by adding row or col you can add totals for the rows and columns to their respective parts of the tables, achieving an end result more like this:
Many of the above commands have shorter versions that can be used to save space and time; full commands are listed because they are less confusing, but if you prefer the short versions type help table. This will also show you more options that Stata offers for constructing tables.