2012 Mobility Survey Results
In January 2012 Computing & Information Services surveyed the Reed community about mobile devices such as smartphones and iPads. We are grateful to the 326 faculty, students, and staff who responded. Provided below is a summary of the results. CIS is now developing plans to address problems identified by the survey. If you have questions or suggestions, please let us know. leavittg@reed.edu
Cell Phone Reception Complaints
(sorted by provider)
Map Key
| AT&T (170) | Verizon (71) |
|||
| Sprint (19) | Other (5) |
|||
| T-Mobile (35) | ||||
What is your affiliation with Reed college?
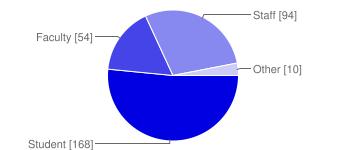
| Student | 168 | 52% | |
| Faculty | 54 | 17% | |
| Staff | 94 | 29% | |
| Other | 10 | 3% |
What type of mobile device and service provider do you have? - iPhone
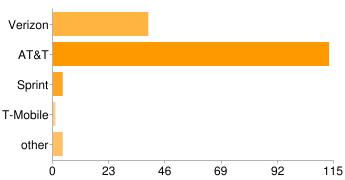
| Verizon | 39 | 12% | |
| AT&T | 113 | 35% | |
| Sprint | 4 | 1% | |
| T-Mobile | 1 | 0% | |
| other | 4 | 1% |
What type of mobile device and service provider do you have? - Android phone
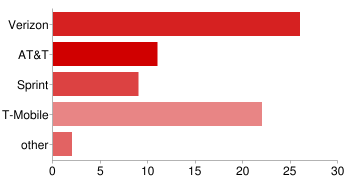
| Verizon | 26 | 8% | |
| AT&T | 11 | 3% | |
| Sprint | 9 | 3% | |
| T-Mobile | 22 | 7% | |
| other | 2 | 1% |
What type of mobile device and service provider do you have? - Blackberry
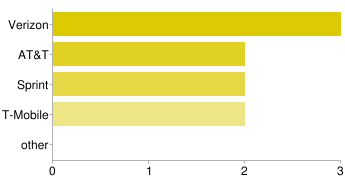
| Verizon | 3 | 1% | |
| AT&T | 2 | 1% | |
| Sprint | 2 | 1% | |
| T-Mobile | 2 | 1% | |
| other | 0 | 0% |
What type of mobile device and service provider do you have? - iPad
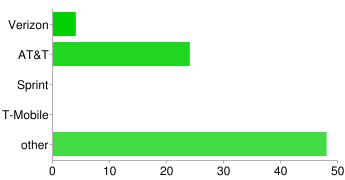
| Verizon | 4 | 1% | |
| AT&T | 24 | 7% | |
| Sprint | 0 | 0% | |
| T-Mobile | 0 | 0% | |
| other | 48 | 15% |
What type of mobile device and service provider do you have? - iPod Touch
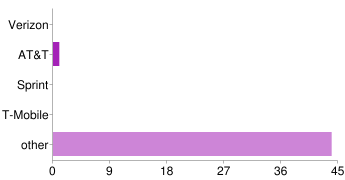
| Verizon | 0 | 0% | |
| AT&T | 1 | 0% | |
| Sprint | 0 | 0% | |
| T-Mobile | 0 | 0% | |
| other | 44 | 13% |
What type of mobile device and service provider do you have? - Android tablet (Kindle, Nook, etc.)
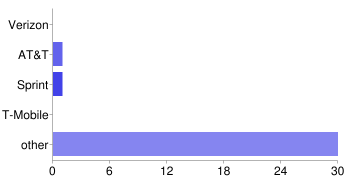
| Verizon | 0 | 0% | |
| AT&T | 1 | 0% | |
| Sprint | 1 | 0% | |
| T-Mobile | 0 | 0% | |
| other | 30 | 9% |
What type of mobile device and service provider do you have? - conventional cell phone
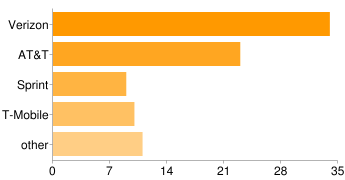
| Verizon | 34 | 10% | |
| AT&T | 23 | 7% | |
| Sprint | 9 | 3% | |
| T-Mobile | 10 | 3% | |
| other | 11 | 3% |
Do you require a password to unlock your device?
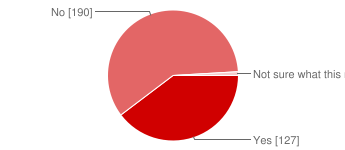
| Yes | 127 | 39% | |
| No | 190 | 58% | |
| Not sure what this means | 3 | 1% |
Do you use Reed's WiFi network(s) for your mobile devices while on campus?
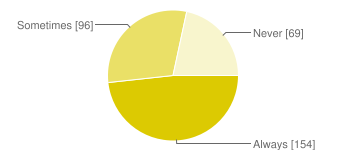
| Always | 154 | 47% | |
| Sometimes | 96 | 29% | |
| Never | 69 | 21% |
What Reed services do you regularly access from your device?
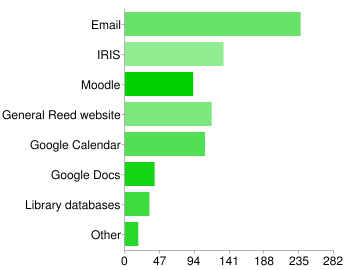
| 237 | 89% | ||
| IRIS | 133 | 50% | |
| Moodle | 92 | 34% | |
| General Reed website | 117 | 44% | |
| Google Calendar | 108 | 40% | |
| Google Docs | 40 | 15% | |
| Library databases | 33 | 12% | |
| Other | 18 | 7% |
People may select more than one checkbox, so percentages may add up to more than 100%.
How can we improve support for mobile devices?
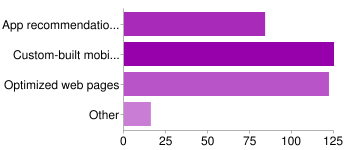
| App recommendations/tutorials | 84 | 41% | |
| Custom-built mobile apps | 125 | 61% | |
| Optimized web pages | 122 | 59% | |
| Other | 16 | 8% |
People may select more than one checkbox, so percentages may add up to more than 100%.