Linear regression
Linear regression assumes a linear relationship between your variables; this can be stated as how much does Y change when X changes one unit, holding all other factors constant. This may be with one or many (multivariate) variables.
Simple linear regression
For my initial regression, I am interested in how much of an effect vehicle weight has on the mileage of vehicles, based on the auto.dta dataset (pre-loaded with Stata).
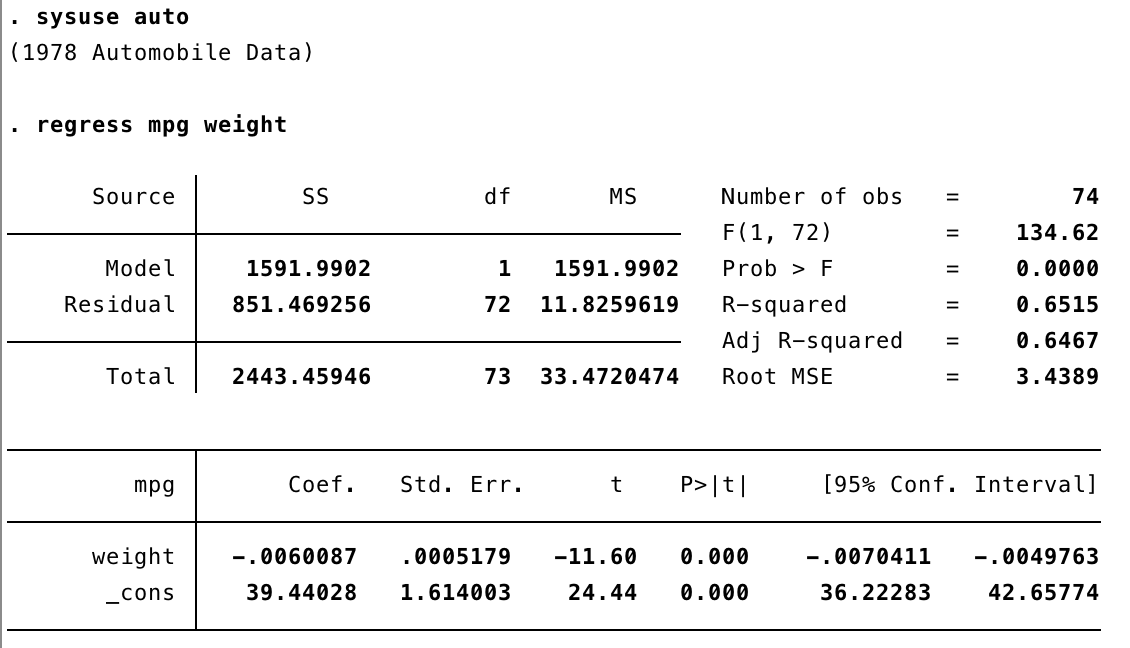 In the output above, you see an ANOVA table showing sum of squares (SS) and mean squares (MS) for the model and your residuals. To the right of the ANOVA table, you see the test statistic (F=134.64) for this test and your number of observations (n=74). Root MSE (mean square error) can be used as a metric of overall fit for your model (lower numbers indicate a better overall fit). Prob > F is the p-value for the overall model; many fields use 0.05 as a threshold value for statistical significance here. R-squared shows the amount of variance in mpg explained by weight (in this case, ~65%). Adjusted R-squared shows that same variance, but taking into account the number of variables and cases in your model.
In the lower table, you have information on individual variables and their coefficients. In this example, we interpret the coefficients as "for every unit increase in weight, mpg decreases by 0.006". (By using describe weight, we can confirm that weight is in pounds.) the t-values and related p-values (P>|t|) test whether or not the coefficient of a variable is greater than zero. In this case, we have evidence that vehicle weight is statistically significant in explaining the mpg of a vehicle.
Multivariate linear regression
For this regression, I am interested in how much of an effect engine size (displacement) and vehicle weight (weight) have on the mileage of vehicles in vehicles in that same dataset. (Note before running analysis, it is a good idea to visualize your data; histograms and scatterplots may be useful for this.)
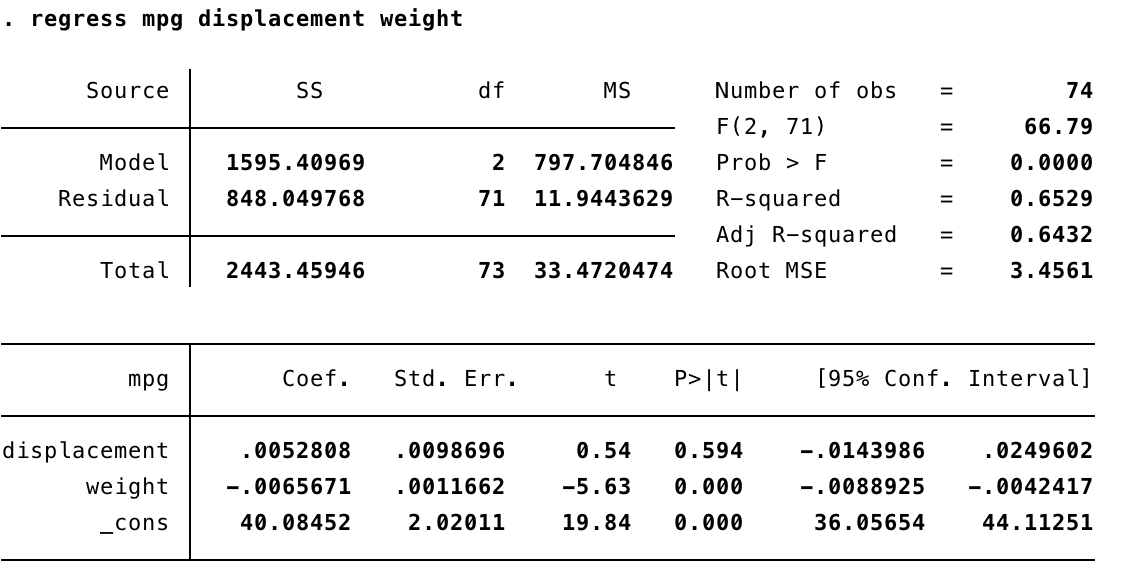 This output is similar to that of the simple linear regression example. With additional variables in our model, we now interpret R-squared as the amount of variance in Y (mpg) explained by X (displacement, weight). Looking at the t-values and related p-values (P>|t|), we conclude that engine size is not statistically significant in explaining mpg.
Note: there are many, many more commands that may be of interest related to linear regression. See Stata documentation below for more on how to transform data, work with weighted data, postestimation commands, and more.
Additional resources: Chapter 1: webbook on regression (simple + multiple) via UCLA
Additional resources: Stata help documentation [regress]