
Tags
"turbines"
The Structure of a Wind Turbine's Vortex
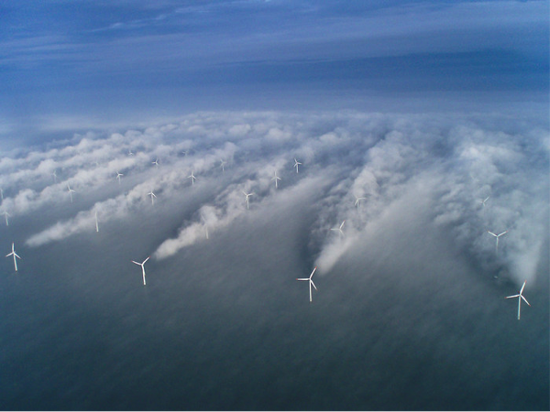
A wind turbine mixes wind into chaotic vortices. These vortices limit efficiencies of the turbines that are located downstream. The tip of the turbine’s blade creates a particularly strong vortex. In the latter part of my research, I have become enthralled with how this vortex’s strength varies across space. This vortex is strongest near the middle of the vortex, and it is weaker farther away. Let us refer to the vortex’s strength as vorticity. Along a line that bisects the vortex, the plot of the vorticity versus the distance is similar to the plot of a Gaussian function, which also known as the normal distribution or the bell curve.
Thus, the vorticity distribution is approximately Gaussian. The reason for this Gaussian approximation is that diffusion smears the vortex out into a Gaussian shape. Diffusion often acts to spread distributions out into Gaussian curves; as you read this sentence, this process occurs around you because diffusion acts to spread heat out towards a Gaussian distribution. Gaussian distributions frequently occur under diffusion because Gaussian convolutions are mathematically simple ways of smoothing out functions. Diffusion spreads a vortex out to a stable, more uniform state by making the distribution into a progressively shorter and broader Gaussian.
Diffusion, however, is not the only force that acts upon a vortex; for interactions between vortices make the vorticity distribution more complicated than a simple Gaussian. A plot of vorticity along a line that bisects a vortex is similar to - yet distinctly different from - a Gaussian. Distributions across various lines differ from Gaussians in different ways. Averaging these plots together gives the graph shown below. The vorticity is normalized by the maximum vorticity of the vortex.
Continue reading The Structure of a Wind Turbine's Vortex
What's Going Around Wind Turbines: Turbulent Vortices
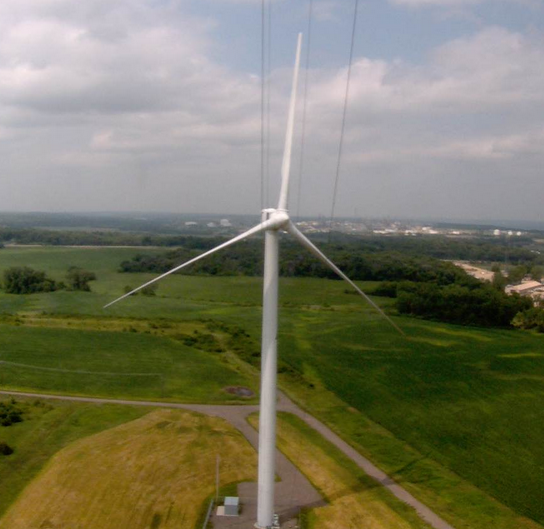
I am researching how wind flows behind wind turbines by analyzing experimental and numerical data. The experimental data has been collected around the turbine that is pictured at right, and the numerical model is based on this turbine.
I’m specifically analyzing the structure and evolution of the vortices that are created at the blade tips. The vortices are caused by areas of low pressure around the turbine. Turbines’ blades rotate because the aerodynamic shape of the blades guides incoming wind into creating a pressure difference that, in turn, drives the blades. Another difference in pressure is due to the fact that the blades block wind, so behind the blade there are fewer air molecules and thus, there is a lower pressure. Objects feel forced to move to lower pressures. Both the blades and the wind are forced into the lower pressure. Some wind wraps around the blades in order to get to the low pressure area.
A vortex forms where the wind curls because the low pressure applies a centripetal force — like how a hurricane is a vortex where wind wraps around the hurricane’s low-pressure eye. Vorticity quantifies how much the fluid rotates around a region. In math terms, the vorticity is the curl of the wind velocity. Strong vortices are created at the blade tips because here the wind can radially bypass the blade, which provides the path of least resistance in the pursuit of lower pressure. This vortex is then pushed downstream by the wind, away from the blades’ low pressure region; the wind continues to curl due to a law of angular momentum conservation. The tip vortices are major sources of turbulence that damage downstream turbines. Consequentially, tip vortex research can lead to improvements in the longevity of turbines in wind farms.
Continue reading What's Going Around Wind Turbines: Turbulent Vortices