Case of the Day: Oil Prices and Consumer Demand
A striking and well-known example of the interaction of supply, demand, and prices is the behavior of the world market for crude oil since 1970. Prior to late 1973, the oil market had functioned more or less smoothly for many years. Outside the Soviet bloc, production was dominated by a group of large American and European corporations that extracted crude oil from reserves in the United States, the Middle East, and elsewhere. The price was low enough that most known offshore reserves were not economically profitable to exploit. The relative price of oil (oil price divided by the price of a broad market basket of goods and services) had remained fairly stable for decades while production expanded with increasing demand resulting from higher world incomes.
In late 1973, war between Israel and its Arab neighbors led to an oil embargo imposed by the Arab members of the Organization of Petroleum Exporting Countries (OPEC) on the United States. Although the embargo was imposed by only a few (large) OPEC members and was initially a political rather than economic act, the effects of the embargo on the U.S. oil market showed OPEC that it had considerable power in the crude oil market. Soon after this, OPEC began to act together as a "cartel" to limit its production of oil and attempt to raise its price.
Beginning in 1979, OPEC once more demonstrated its influence on the world oil market when it again constrained supply. Some of the impetus for the disruption of supply came when the pro-American government of the Shah of Iran was overthrown by Islamic radicals who were hostile to the West. In the early 1980s, OPEC effectively controlled the world price of crude oil by restricting supply. However, a few years later, OPEC seemed to find it more difficult to maintain high oil prices as its share of the market had shrunk considerably. Non-OPEC production increased from about 25m bbl/day in 1973 to over 38m bbl/day in 1987. At the same time, OPEC production fell from about 30m bbl/day in 1973 to well under 20m bbl/day through most of the late 1980s.
After many years of relatively low oil prices, the world oil price spiked again starting in 2004 due to actual and potential supply disruptions in the Middle East accompanied by rapid growth in oil demand from China and elsewhere. Despite depressed demand associated with the recent global recession, current oil prices are in the neighborhood of $110/bbl. This has set economists back to work trying to estimate the relevant elasticities and predict the possible future course of oil markets.
Estimates of elasticities vary across countries and time periods, and according to the methodology used. The price elasticity of US demand for oil is often estimated to be around -0.05 in the short run and in the neighborhood of -0.3 or perhaps higher in the long run. Estimates of the long-run income elasticity in developed countries like the United States are around 0.4. Estimates of the elasticity of non-OPEC supply in the long run are around 0.35.
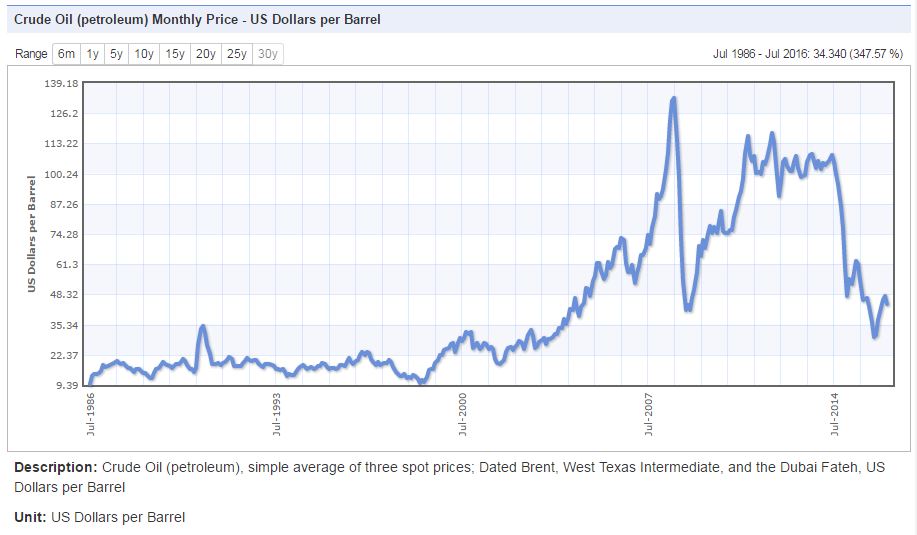
The dollar oil price from 1986 to 2016 is shown below (source):
Decomposing oil-price changes into the effects of demand and supply shifts is tricky. The Federal Reserve Bank of New York attempts this task on a weekly basis here. Go to the site and click on the appropriate link there to download the document for the week you want. Of special interest is the graph labeled "Cumulative Weekly Decomposition," which shows how the effects of demand and supply shifts have affected oil prices since 2010.
For more historical information, a spreadsheet with time series from 1970 to 2006 for several major oil-market and gasoline-market variables is available here for use in your analysis, particularly in question 3. (Thanks to 2008 grad Andreea Jurculet for excellent work in compiling these data and researching elasticity estimates for me!) Additional data (including more recent numbers) are available from the U.S. Department of Energy's Energy Information Agency.
Questions
1. Why is gasoline demand (and oil demand in general) very inelastic in the short run?
2. What responses are available to consumers in the long run that make the long-run elasticities so much larger than the short-run elasticities?
3. To what do you attribute the crash in oil prices that occurred in 2008, when the price fell from $132.55 in July to $41.53 in December? Are huge month-to-month price changes such as we see in the oil market more consistent with highly elastic or with highly inelastic demand and supply curves? Explain.
4. If no major unforeseen disruptions to the world oil market occur in the next ten years, what path would you predict for oil prices based on the historical experience, the estimated elasticities, and any differences of which you are aware between the historical situation and the present situation? Explain how you arrived at this conclusion and what assumptions you are making about other variables.