Case of the Day: U.S. Disinflation in 1979-82
The 1970s were a rough economic decade for the United States and most of Europe. As the decade began, the United States was beginning to unwind its long, bloody, and expensive military involvement in Vietnam. Figure 1 shows the evolution of output, inflation, and unemployment from 1970 through 1989. (The data for growth and inflation in Figure 1 are "smoothed" in the sense that each quarter's observation is the change from one year earlier, rather than the annualized change from the previous quarter.)
Figure 1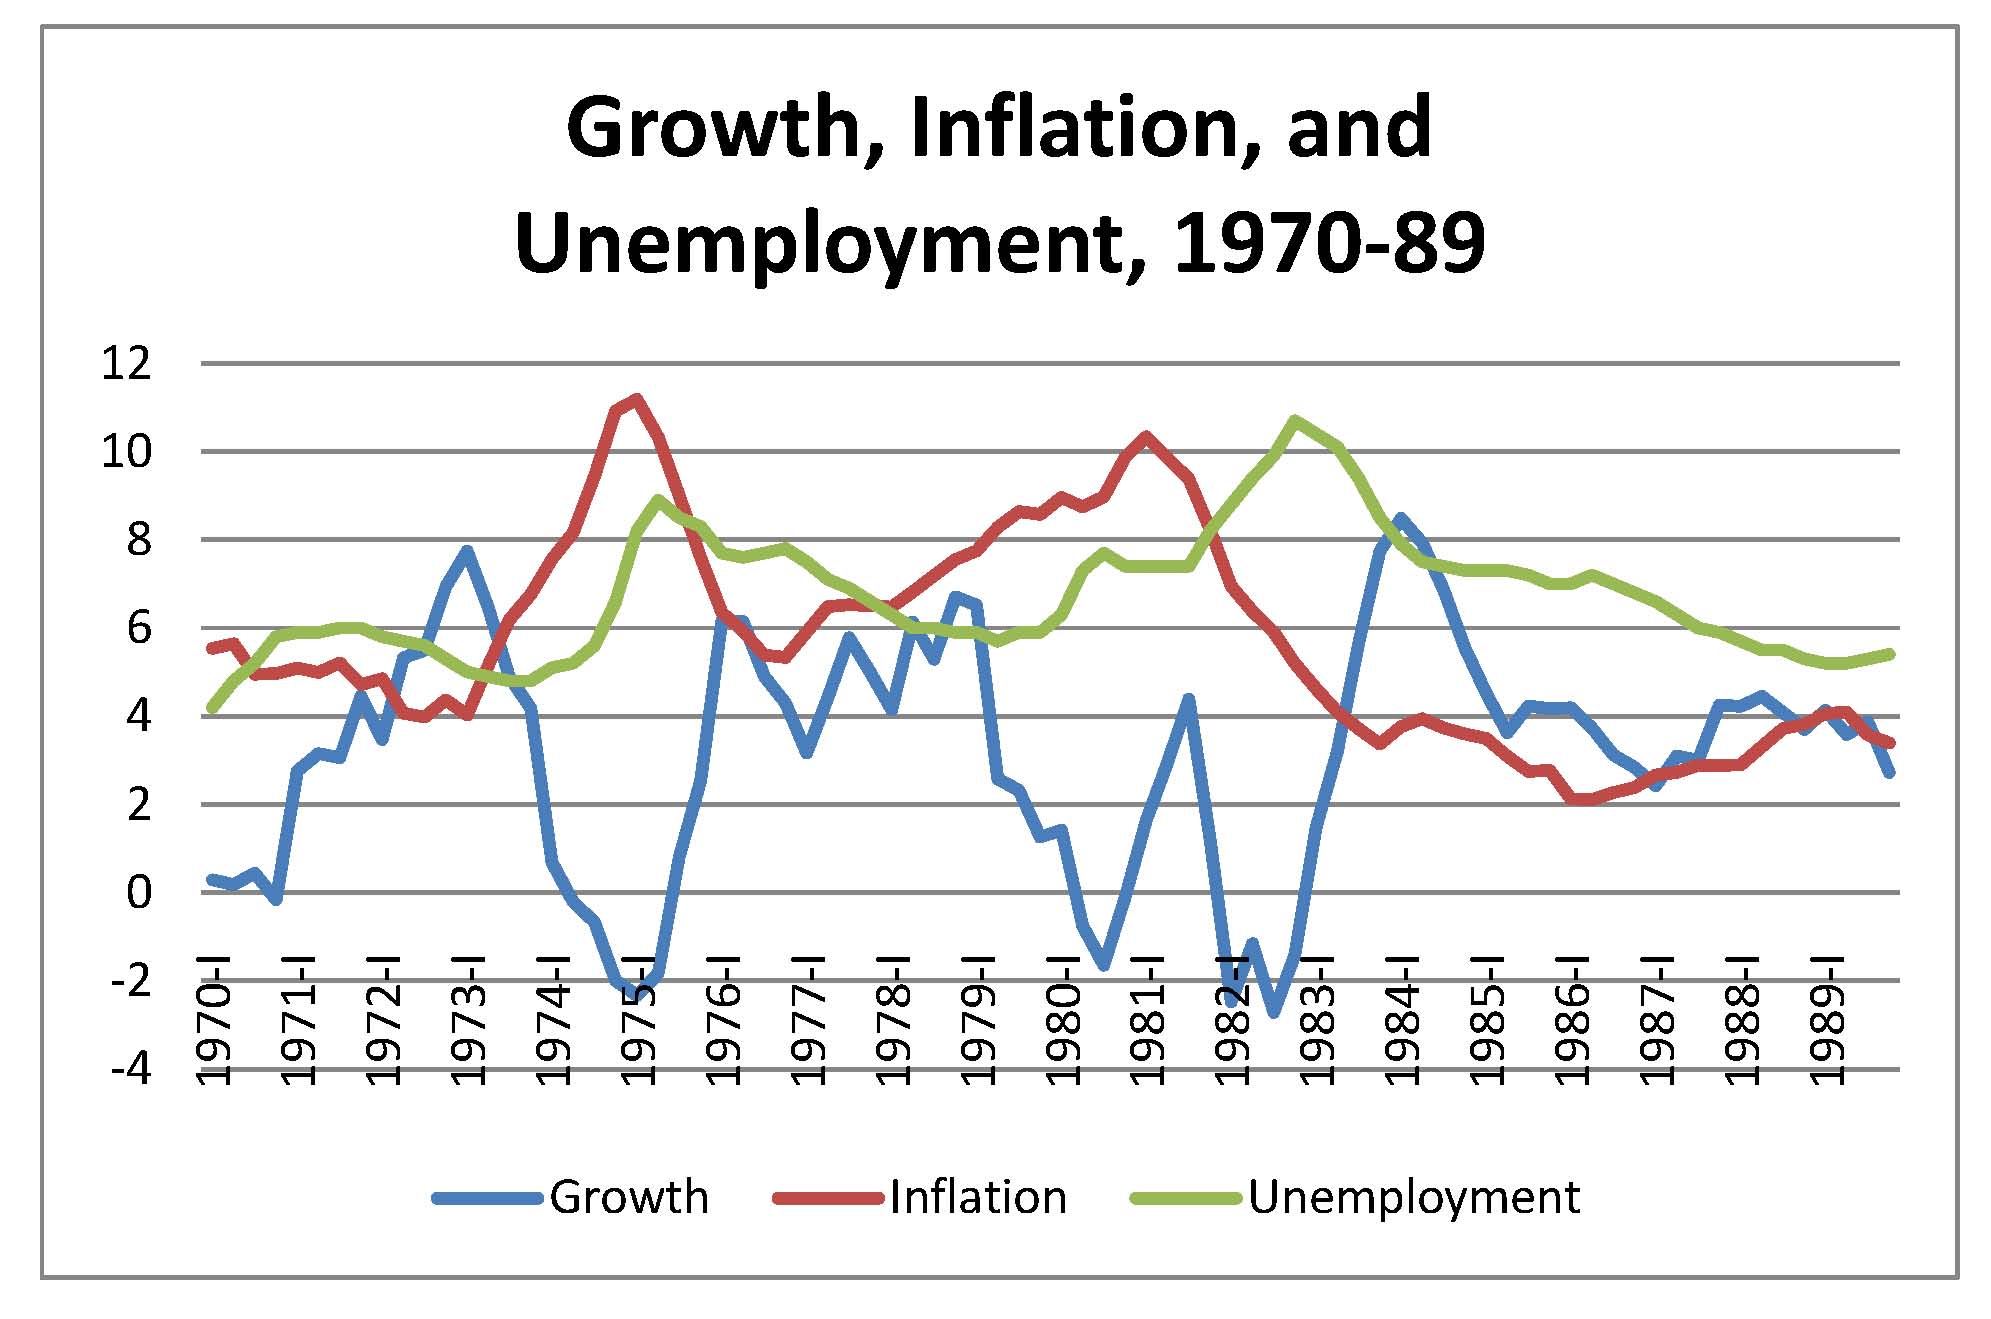
Figure 1 shows several important patterns of macroeconomic activity over the 1970s and early '80s, leading up to relative tranquility by the end of the 1980s. We can break these two decades into important sub-periods:
- 1970-73 Late Vietnam War: Accelerating growth during recovery from mini-recession in 1970. Unemployment near natural rate. Inflation high by U.S. historical standards. Inflation was subdued some by wage-price "guideposts" imposed by the Nixon Administration.
- 1974-75 First oil-price increase: Oil embargo of late 1973 is followed by quadrupling of nominal oil price. Stagflation. High unemployment, a major recession, and increasing inflation.
- 1976-79 Recovery: Unemployment gradually falls as economy recovers with rapid output growth. Inflation falls back under 6% but then begins to rise, reaching 8% by 1979.
- 1979-83 Double-dip recession: Iranian Revolution in 1979 disrupts oil markets and leads to another quadrupling of the nominal oil price. Volcker's Fed applies strongly contractionary monetary policy starting in late 1979 to deal with high inflation. Recession in 1979-80 is followed by even larger one in 1982-83. Inflation spikes with the increase in oil prices, then begins steady fall to around 2% by 1986.
- 1983-89 Recovery and stability: GDP grows rapidly during recovery from steep recession of 1982-83. Oil prices fall back to low levels as Iran and Iraq resume production and OPEC feuds. Unemployment gradually falls and inflation is stable and relatively low.
The rise of inflation
From 1948 until 1971, the world's monetary affairs operated under the Bretton Woods system, a set of monetary arrangements named after the opulent New Hampshire resort at which the world's leading economists and politicians hammered out an agreement about the successor system to the defunct gold standard. The gold standard, with each individual currency convertible into gold at a fixed parity, had worked reasonably well during most of the 19th century and up to World War I. During World War I, as was typical for warring countries under the gold standard, the major countries of Europe temporarily suspended currency convertibility and used large amounts of their gold to purchase war materials and other goods from abroad—especially from the United States. As a result, the worlds' gold reserves were disproportionately owned by the United States, with Britain, France, and Germany having little gold left to back their currencies. The attempt by Britain to restore its pre-war gold parity left it depressed for much of the 1920s, leading into the Great Depression of the 1930s when the gold standard was abandoned. Germany's monetary chaos led to hyperinflation and eventually to the rise of Hitler.
After World War II, economists were wary of repeating the disastrous aftermath of the previous war when gold once again was heavily concentrated in U.S. vaults. Under the Bretton Woods system, the United States dollar would serve in place of gold as the international reserve asset. Each country would maintain convertibility between its currency and the dollar, holding reserves of dollars rather than gold. The U.S. was to maintain a fixed parity between the dollar and gold at $35/ounce, assuring that there was a "real anchor" to the international monetary system. However, under the rules of the Bretton Woods system, the U.S. Treasury would only convert dollars into gold for foreign governments, not for individuals or corporations. Thus, unless a foreign government asked for gold there was nothing preventing the U.S. from inflating the dollar. (The Bretton Woods agreement also established the International Monetary Fund to monitor and organize the international monetary system and the World Bank to provide assistance to developing countries.)
During the 1960s, government expenditures on the Vietnam War and the Great Society social programs of the Johnson Administration threatened to increase government deficits and raise interest rates as the government borrowed on domestic credit markets. The Federal Reserve generally "accommodated" these deficits by increasing purchases of government debt and expanding the money supply, keeping interest rates low in the short run. As the 1960s wore on, the cumulative impact of expansionary policies pushed a gradual increase in the rate of inflation. By 1970, the official price of $35/ounce was very unrealistic, but until the summer of 1971 no foreign government called the Treasury's bluff and asked for dollars to be converted to gold. When France did so in 1971, the Nixon Administration responded first by devaluing the dollar to $38/ounce, then in August by closing the gold window, officially ending the Bretton Woods system and with it any connection between the monetary system and gold.
As a result, by the end of 1971 the United States was officially on a fiat-money standard and the Federal Reserve was freed from any obligation to keep the dollar tied to any commodity standard—creating inflation became legally much easier with the dollar untethered from its official $35/ounce anchor.
The oil shocks and stagflation
We have discussed the microeconomic effects of the oil shocks at some length in earlier case studies. The macroeconomic effects were equally significant. The embargo of 1973 followed by large increases in the price of imported oil was the first major example of an adverse supply shock. The increase in production costs associated with more expensive imported oil pushed the short-run aggregate supply curve up and to the left, leading to a severe case of "stagflation."
We have noted in the Great Depression case that inflation often tends to be "procyclical," moving in the same direction as real output growth. From 1973 to 1975, Figure 1 indicates a strong countercyclical movement of inflation: output fell into a recession and unemployment rose at the same time that inflation spiked into the unprecedented region of double digits.
The traditional Phillips curve, based on a century of data for the U.S., Britain, and other countries, had no explanation for stagflation: it predicted that unemployment would be low whenever inflation was high, and vice versa. It was as a result of this "new phenomenon" that the "natural-rate hypothesis" and the theory of the expectations-augmented Phillips curve became widely accepted. (These theories had actually been proposed most presciently by Milton Friedman in his 1967 presidential lecture to the American Economic Association and developed in a famous 1970 book edited by Edmund Phelps.)
The Fed, under the chairmanship of distinguished monetary economists Arthur Burns, faced an unprecedented conundrum: Should they follow a contractionary policy to lower inflation or an expansionary policy to mitigate the recession and unemployment? The Burns Fed generally pursued accommodative policies, opting to allow inflation to continue rather than risk raising unemployment further. Inflation persisted at 6 to 8% through the remainder of Burns's tenure and the brief service of his successor William Miller.
The bad news on the oil front just got worse at the end of the decade. In early 1979, the Ameri-philic regime of the Shah of Iran was toppled by violent protests, leading to the establishment of an Islamic Republic by the returning Ayatollah Khomeini. Relations with the United States became ever more testy and broke completely with the taking of hostages in the U.S. Teheran embassy late in the year. By 1980, Iran was involved in a bloody war with neighbor and OPEC sibling Iraq, drastically reducing oil supplies to the United States for the second time in a decade. Once again inflation and unemployment both headed upward putting pressure on the Fed to choose a policy course from two unpalatable options: fighting inflation at the risk of higher unemployment or trying to stimulate the economy but potentially pushing inflation up well into double digits.
The Volcker Fed
Amid the rising inflation and as the second oil shock was about to hit the economy, a change of command occurred at the Fed. In August 1979, William Miller was "kicked upstairs" and named Secretary of the Treasury by President Carter. Replacing him at the Fed was widely-respected Wall Street, Treasury Department, and Federal Reserve veteran Paul Volcker, who was, prior to his appointment as chair, president of the New York Federal Reserve Bank. The change from Miller to Volcker was widely viewed as an attempt by the Carter Administration to move more aggressively against inflation.
During the late 1970s, the Fed had been following a mixed policy utilizing both money-growth targets and an interest-rate operating rule. At each meeting, the FOMC would set a target range of growth for M2, their preferred monetary aggregate. For example, they might set a range of 6-6.5% annual growth for M2 in order to attempt to slow inflation. However, because M2 cannot be monitored on a day-to-day basis (it includes bank deposits on which the Fed gets data only once a month), the Fed would implement their target by estimating (using their econometric models) the level of the federal-funds interest rate that would yield the desired growth in M2. The trading desk at the New York Fed would then keep the funds rate at the calculated level during the seven weeks between meetings.
Unfortunately, the Fed's econometric models were not keeping up with changes in market behavior in the federal-funds market. At meeting after meeting, the FOMC would discover that they had set the funds rate too low to meet their targets and that M2 had ended up growing faster than they had wished.
After two months on the job, Volcker's called a secret meeting of the FOMC on Saturday, October 6, 1979. With markets closed until Monday so that traders could digest the implications, Volcker announced a major change in the Fed's operating rule. Instead of having a narrow target for the funds rate, they widened the interest rate target and focused more on day-to-day control of the growth in bank reserves. You should read the article written by Carl Walsh of the San Francisco Fed on the 25th anniversary of this watershed policy change for additional perspective.
After the change in policy, the funds rate (see Figure 2) leaped to unprecedented heights and, apart from a period in 1980 when the Fed was using other policies to restrain lending, remained in the high teens until 1982.
Figure 2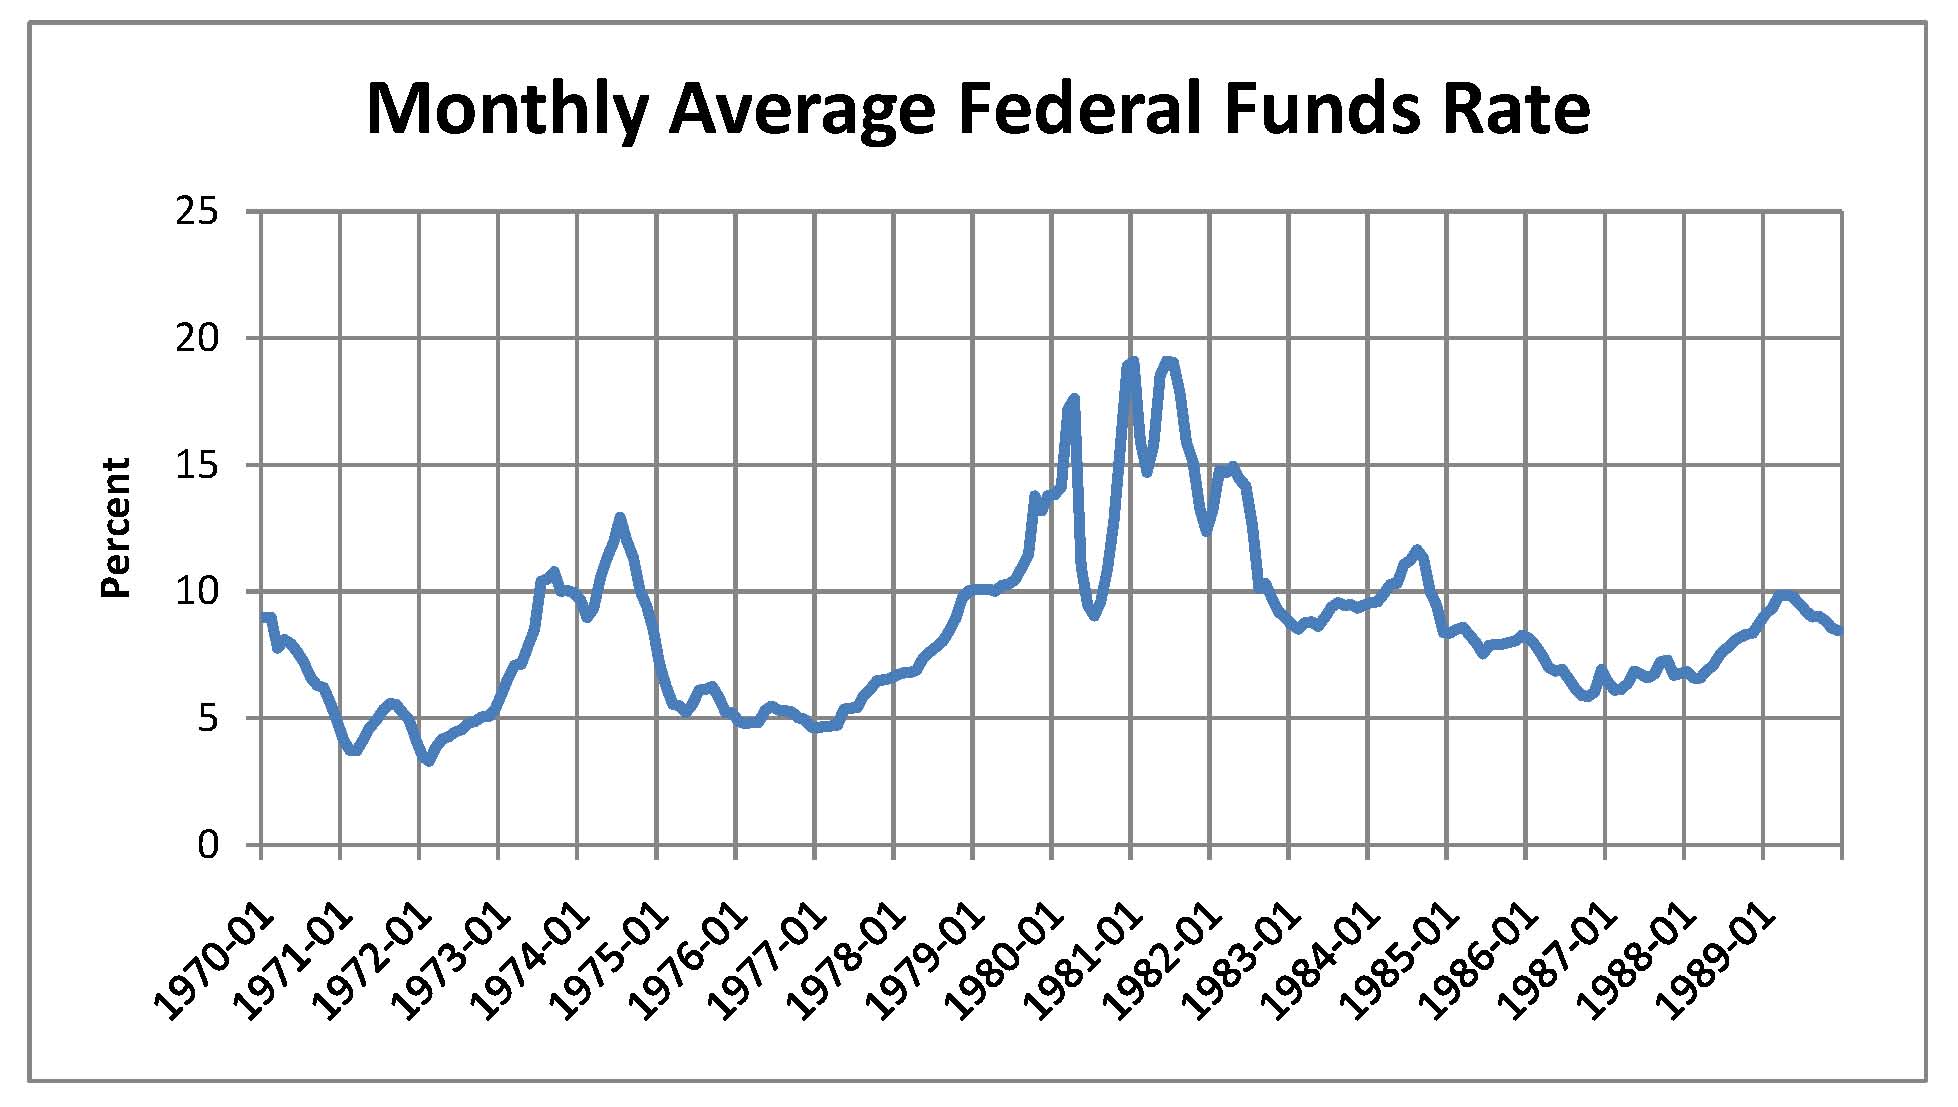
Recession, disinflation, and recovery
The restrictive anti-inflation policies of the Volcker Fed were brutal by the standards of monetary policy. Coupled with the disruption of the second oil shock, they sent unemployment soaring into double digits for the first time since the Great Depression. A brief recession in 1980 was followed by a deeper one in 1982-83 as the impact of monetary contraction bit.
However, the policies accomplished their anti-inflationary mission. After tipping back over 10% in late 1980 due largely to oil price increases, the inflation rate moved steadily downward, settling below 4% by 1983 and sliding to a most comfortable 2% in 1986 (aided by the collapse of oil prices). GDP growth recovered robustly in 1984 and the unemployment rate fell back to normal levels.
Questions for analysis
1. In retrospect, it is likely that economists of the time underestimated the natural rate of unemployment during the late 1960s and 1970s. Use the modern Phillips curve to explain why aggressive monetary policy to keep the unemployment rate lower than the natural rate would lead to accelerating inflation.
2. The modern theory of the Phillips curve (the "natural-rate hypothesis") predicts that unemployment (relative to the natural rate) is inversely related to the difference between actual and expected inflation. Suppose that the disinflation associated with Volcker's contractionary monetary policy had been correctly anticipated. What does the theory predict would have happened to unemployment as inflation fell?
3. Now suppose that the disinflation was not correctly anticipated but instead inflation expectations remained high. What does the theory predict about unemployment in this case? Which prediction better fits the historical record of Figure 1? Does that imply anything about whether people believed the Volcker's strong announcements about a change in policy?
4. Paul Volcker would be in the Monetary Policy Hall of Fame (if there were one) as a result of his successful conquest of inflation. Based on what you've read about the costs of inflation and unemployment, was it worth it? Are we better off today as a result of the actions of the Volcker Fed? If your answer is yes, are we enough better off to justify the costs incurred by those living through the 1982-83 recession?