|

|
Some chemists claim electron density is a physical substance, while others view it as a purely mathematical entity. Whichever point of view one adopts, one can ask, "how do I draw a picture that shows how electron density changes from point to point?" So far, no one has found a completely satisfactory answer to this question. A complete graph of r(x, y, z) (rho(x, y, z)) requires a four dimensional drawing. Three coordinates are needed to locate the independent variables (x, y, z) and a fourth is needed to show the value of r (rho). Because we live in a three-dimensional world (and computer screens are only two-dimensional), we have to make do with partial pictures of the electron density cloud. Either we graph r (rho) over a limited set of locations, (say, across a plane cutting through our molecule), or we graph a few special values of r (rho) and ignore the others. Examples of both approaches are shown below.
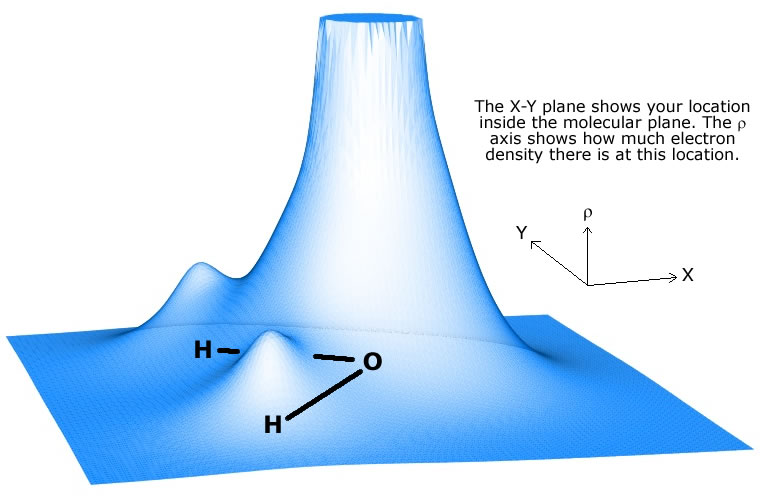
Graphing r (rho) in a plane - H2O The following graph shows r (rho) at different points in the molecular plane of H2O (a molecular plane is defined as the one that contains all of the nuclei).
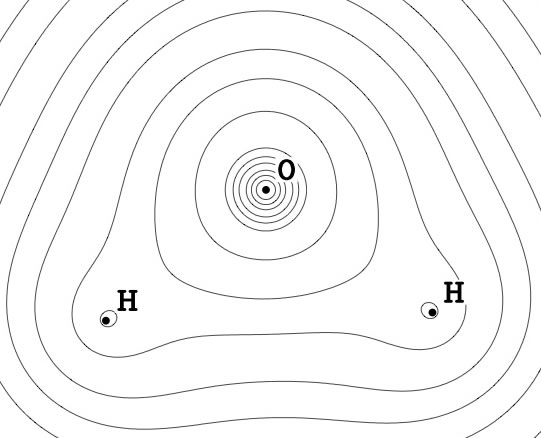
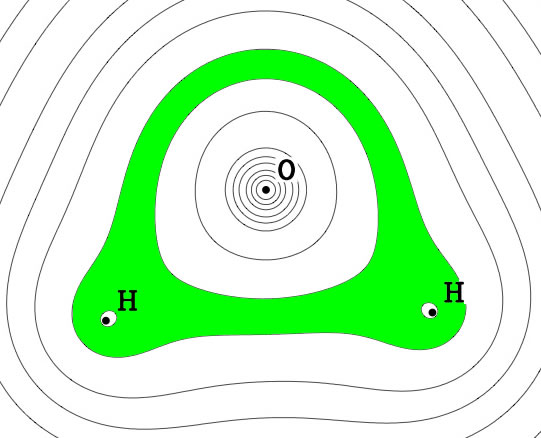
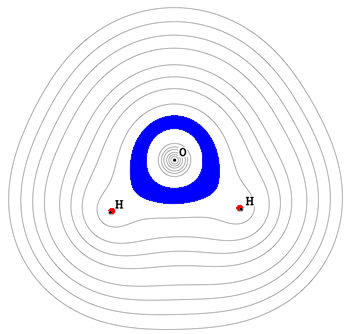
The nuclei lie in the horizontal plane. An H nucleus lies under each small hill and the O nucleus sits under the fantastically tall mountain (the graph shows only the base of the mountain because r (rho) gets very large as we approach the O nucleus). Of course, there aren't really any "hills" or "mountains" in the electron density cloud because the vertical axis is not a spatial coordinate. It only shows how r (rho) changes. If you went for a walk in the molecular plane, you would find some negative charge bunched up around each H nucleus, and much more surrounding O, but you would not travel up and down in space. Here is another picture of r (rho) in the molecular plane: This graph consists of a series of nested curves called contours. Each contour is equivalent to a particular "elevation" in the previous graph, that is, to a particular value of r (rho). The contours are not labeled, but we saw in the previous graph that electron density rises steadily as we move towards each nucleus. Therefore, "inner" contours are always higher (r (rho) values) than "outer" contours. Applying this principle to the contour graph then leads to the same conclusion as before: there is a small "hill" of electron density around each H and a very tall, relatively broad "mountain" around O. The next graph is a color-coded version of the previous graph, and it shows the difference between H and O more clearly. This graph was created from the previous one simply by coloring the gap between two contours.
The colored zone does not include the region right around each H nucleus (nuclei are represented by dots; a larger version of each graph can be seen by clicking on the graph). This means rH nucleus (rhoH nucleus) is slightly higher than rgreen (rhogreen). On the other hand, many contours separate the green zone from the O nucleus, and these contours cover a relatively large region of space. Clearly, the O nucleus attracts much more electron density than either of the H nuclei.
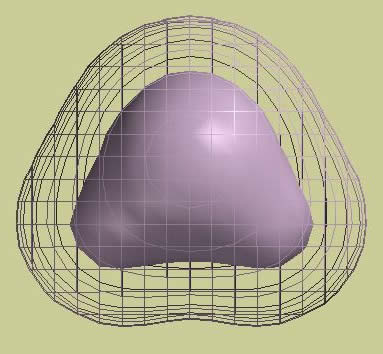
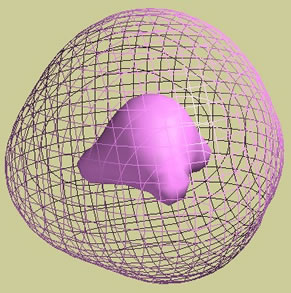
Graphing particular values of r (rho) in 3 dimensions - Isodensity surfaces It is also possible to construct three dimensional contour graphs. We can only look at one or two contours at a time, however, because "outer" contours tend to hide "inner" ones. Three-dimensional contours of r (rho) are called isodensity surfaces (iso = "same" in Greek). The following picture shows two isodensity surfaces of water, a "mesh" style for the outer surface and a "solid" style for the inner one (the "mesh" style makes it possible to look inside at other surfaces).
Since this picture shows only two isodensity surfaces, it tells us much less about the overall distribution of electron density than the previous pictures. On the other hand, it offers us something special: three-dimensional data (especially when the image is rotated on a computer screen). When you look at an electron density cloud, you should always assume that r rises as you move inward and falls as you move outward. In the case of a three-dimensional picture, like the one above, you should assume: routside mesh < rmesh < rsolid < rinside solid (rhooutside mesh < rhomesh < rhosolid < rhoinside solid).
Review problems #1. Two isodensity surfaces of ammonia, NH3, are shown below. Where does one find the lowest electron density: on the outer (mesh) surface? on the inner (solid) surface? inside the inner surface? outside the outer surface?
#2. This is a contour graph of electron density in the molecular plane of a water molecule (it is identical to the graphs shown above). I have filled in the spaces between some of the contour lines with blue (near O) and red (near H) colors. Answer the questions listed below the picture.
a. Does r (rho) rise, fall, or stay constant as one travels from the outside of the blue region to the inside? b. Is r (rho) higher, lower, or the same at the outer edges of the blue and red regions? |