Badger Network Visualization
Anna Ritz (aritz@reed.edu)Skip to [Meta Information] [Overview] [Assignment] [Resources] [Contact & Acknowledgements]
Meta Information
| Summary | Badger Network Visualization: An interactive, web-based graph visualization of an animal social network dataset that is used to study the spread of disease in the population. |
|---|---|
| Topics | Graph manipulation and formats (edge lists and adjacency lists), working with objects, working with an API, (optionally) graph centrality measures and algorithms. Part of the assignment provided includes reading primary literature, but it is not necessary to understand the data for a CS course. |
| Audience | Used in a programming-heavy computational biology course, which has a CS1-equivalent prerequisite. The preliminary lab and assignment takes about 1-1.5 weeks, and is relatively easy with a bunch of more advanced extensions available. |
| Difficulty | The assignment described for non-CS majors and appropriate for late CS1/early CS2. It could be easily adapted for visualizations of data structures and graph algorithms. |
| Strengths | There is a very quick buy-in by students because: (a) they customize their own graphs, (b) there is a connection to an accessible, real-world dataset, and (c) it is visual and interactive. There is lots of flexibility in using this for future assignments that involve graph algorithms. |
| Weaknesses | The assignment does not build on specific CS1/CS2 topics, since it is taught in a biology department. We are working on making the GraphSpace Python Client more accessible for early-stage programmers. |
| Dependencies | The interactive web browser has a Python interface, so the assignment is in Python. However, the website allows JSON uploads for those wishing to use other languages. Contact Anna Ritz and she can provide more specifics; there are also more details in the Resources & Extensions section. |
| Variants | There are lots of variants of this project. Students can visualize other networks (GraphSpace can easily render graphs with a few hundred nodes). Students can also visualize a ton of graph algorithms with the badger network, including community detection algorithms, network flow algorithms, shortest path and spanning tree algorithms, and graph layout algorithms. The data could be used alongside other graph libraries. |
Overview: Animal Social Networks
Social network analysis has become a major research area, mining massive online dataset to extract communities, determine trends, and identify potential consumers. This type of analysis has also been applied to social species, where animals interact with each other and tend to form rules and have roles related to survival (hunting, foraging, rearing young, and defense). A dolphin social network has become a benchmark dataset for community detection and other graph algorithms on Mark Newman's Network Data page.
Badgers also exhibit social behavior. In this Nifty Assignment, students will visualize a social network of a well-studied population of badgers in the United Kingdom. In the open access Current Biology correspondence by Nicola Weber and others (only two pages long!), the authors use a network flow algorithm to model the spread of Tuberculosis (TB) in this population.
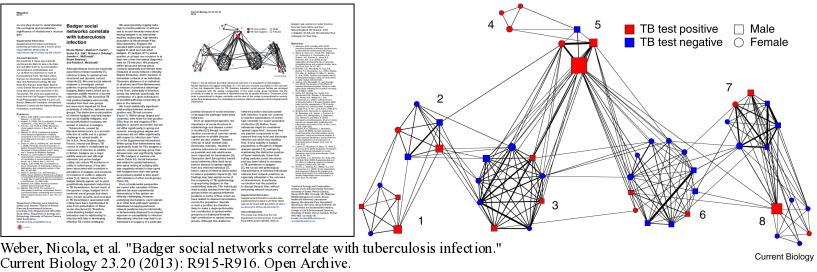
The network in the figure shows the badgers organized by communities (called setts) and provides information about the sex and TB status of each badger. Students will generate an interactive, graph-based version of this image using GraphSpace:
Assignment
There are two parts to this assignment. The instructor should make an account on GraphSpace and has the option to make a Group for the class, which will contain all the networks generated by students.Part 1: Dolphin Social Network Lab: This lab establishes preliminaries about posting graphs to GraphSpace, and is designed to be done in a group setting.
- Instructions
- Text Files: [dolphin_edgelist.txt] [females.txt] [males.txt] [unknown-sex.txt] [side-floppers.txt] [upside-down-lobtailers.txt]
- Citation:
Lusseau, David. "Evidence for social role in a dolphin social network." Evolutionary ecology 21.3 (2007): 357-366.
Open Access publisher link
(Mark Newman's page provides the network in GML format) - Example Solution on GraphSpace
Part 2: Badger Social Network Assignment: This is a 3-5 day take-home programming assignment to visualize the badger network. Students need to parse a weighted adjacenty matrix and post a graph with multiple types of visual annotations related to badger sex, sett, and TB status.
- Instructions
- Text Files: [badger-matrix.txt] [badger-info.txt]
- Citation:
Weber, Nicola, et al. "Badger social networks correlate with tuberculosis infection." Current Biology 23.20 (2013): R915-R916.
Open Access publisher link - Example Solution on GraphSpace
Resources and Extensions
GraphSpace- http://graphspace.org
- Bharadwaj, Aditya, et al. "GraphSpace: stimulating interdisciplinary collaborations in network biology." Bioinformatics 33.19 (2017): 3134-3136. Publisher Link.
- GraphSpace User Manual
- GraphSpace Python Client Manual
- Python GraphSpace Client Cheat Sheet
- Lusseau, David. "The emergent properties of a dolphin social network." Proceedings of the Royal Society of London B: Biological Sciences 270.Suppl 2 (2003): S186-S188. Open Access publisher link.
- Lusseau, David. "Evidence for social role in a dolphin social network." Evolutionary ecology 21.3 (2007): 357-366. Open Access publisher link.
- Weber, Nicola, et al. "Badger social networks correlate with tuberculosis infection." Current Biology 23.20 (2013): R915-R916. Open Access publisher link.
- Silk, Matthew J., et al. "Using social network measures in wildlife disease ecology, epidemiology, and management." BioScience 67.3 (2017): 245-257. Open Access publisher link.
- Extensions to computational molecular systems biology: Many other network-based models exist in biology, including molecular networks. A GraphSpace tutorial for analyzing molecular interaction networks is available through an undergraduate workshop hosted at Carleton College in 2018. This tutorial is completely web-based and uses Repl.it.
- Extensions to other network datasets: Mark Newman provides a list of freely-available network datasets on his website. For example, students can post Zachary's karate club network to GraphSpace.
Contact and Acknowledgements
If you have any questions about the assignment or GraphSpace, please do not hesitate to contact Anna Ritz:
- Anna Ritz, aritz@reed.edu
- Biology Department, Reed College
- 3203 SE Woodstock Blvd, Portland, OR
- https://www.reed.edu/biology/ritz/
This assignment is part of an upper-level biology course called Computational Systems Biology (assignments were extended from the Fall 2019 offering).
Special Thanks to those involved in the Badger social network study, especially:
- Robbie McDonald, Environment and Sustainability Institute, University of Exeter
- Nicola Weber, College of Life and Environmental Sciences, University of Exeter