|
|

|
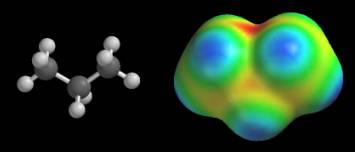
Standard color scale When we use the default color scale, we know that the red and dark blue regions correspond to the extreme values of the electrostatic potential, but how can we know what these extreme potentials are? Different maps have different extremes. As a result, if we don’t know the numerical value of the extreme potentials, we might be fooled into thinking that we are looking at large extremes (and large differences between extremes) when we are not. Consider the potential map of propane, CH3CH2CH3, shown below. This map is colored according to the default scale. It turns blue near every hydrogen, and yellow-orange around every carbon (the “cavity” at the top of the map is bordered by all three carbons and is red). These colors seem to suggest that the potential swings wildly between hydrogen (medium-dark blue) and carbon (yellow-red).
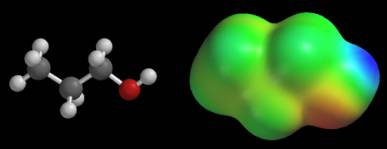
Now examine the potential map of 1-propanol, CH3CH2CH2OH, shown below. This map is also colored according to its default color scale. Extreme potentials are located near the OH group. The CH3CH2CH2 group is almost uniformly green. This suggests that the potential does not change much between hydrogen and carbon in this molecule.
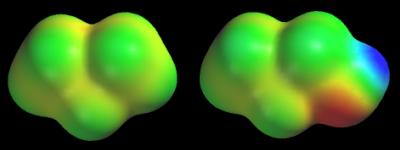
There does not appear to be any consistency in these maps. The CH3CH2CH2 group appears to generate extreme potentials in propane, but a nearly constant potential in 1-propanol. If we carry this idea to its logical conclusion, we would say that the CH3CH2CH2 groups are radically different in these molecules. Unfortunately, this conclusion is contradicted by several other types of data (bond distances, isodensity surfaces, electronegativity data, and so on), so we must seek another explanation. The answer lies in the numerical value of the extreme potentials. The potentials on the propane map swing from –22 to +4 kcal/mol, while the potentials on the 1-propanol map cover a much wider range, -48 to +44 kcal/mol. Since both maps use the same number of colors, each color on 1-propanol’s map covers a wider range of potentials. This is why the entire CH3CH2CH2 group has roughly the same color on the 1-propanol map. We can avoid these problems by giving the values of the extreme potentials for every map. When the extreme potentials are known, the meaning of other colors can be inferred as follows:
Green always corresponds to a potential halfway between the two extremes (red/dark blue). Yellow and light blue split the difference between the mean (green) and the extremes (red/dark blue). Applying this to the 1-propanol map (red = –48 and blue = +44 kcal/mol) gives green = –2, yellow = –25, and light blue = +21 kcal/mol. Notice that the entire potential range of propane’s map, –22 to +4 kcal/mol, would be assigned two colors, green and yellow, on 1-propanol’s map. Another solution that we can also use is to color the maps of neutral molecules using a standard color scale. My definition of this scale places the extremes at -40 (red) and +40 kcal/mol (dark blue). This means that intermediate colors correspond to modest potentials of –20 (yellow), 0 (green), and +20 (light blue) kcal/mol. The following figure shows the potential maps of propane and 1-propanol colored according to my standard color scale (remember that we have not changed the potentials, just the colors assigned to each potential). Now the CH3CH2CH2 group looks roughly the same in both molecules.
The standard color scale is useful, but it is not entirely free of problems. Suppose the potentials on a given map lie outside the standard extremes, that is, suppose some potentials are less than –40 or greater than +40 kcal/mol. What colors does the standard color scale use for these potentials? The answer is simple: red and dark blue. This means that the extreme colors are not always trustworthy. They might identify potentials of ±40 kcal/mol, or they might correspond to potentials outside these limits. Applications At this point, we have learned about several tools for analyzing electron density clouds: contour graphs, isodensity surfaces, and potential maps. The potential map is generally more useful than the other tools, however, because it shows the interplay between nuclear charge and electron density. The following sections show some of the ways chemists use potential maps. As you read these sections, pay equal attention to the ways in which potential maps are used, and the chemical lessons that the maps teach. Both topics are important. Also, keep in mind the following points:
|