|
|

|
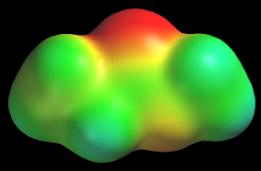
Polar C–X bonds Carbon is only slightly more electronegative than hydrogen. Therefore, we expect C–F, C–O, and C–N bonds to be polar, just like the corresponding H–F, H–O, and H–N bonds. Unfortunately, polar bonds involving carbon are almost impossible to detect using potential maps. Methyl propionate, CH3CH2C(=O)OCH3, furnishes us with a good example of this phenomenon. Two carbons in this molecule are bonded to oxygen. The methyl carbon makes one CO bond, O-CH3, and the carbonyl carbon makes three CO bonds, C(=O)-O. Since all of the CO bonds are polar, all of them transfer electron density from carbon to oxygen and we expect to find large positive potentials around these carbons. The following potential map of methyl propionate standard color scale) shows that this does not happen. The potential near each carbon is very small.
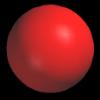
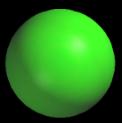
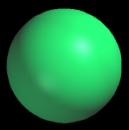
Two factors account for these observations. First, the “local” atom principle breaks down near carbon whenever it is sandwiched between several other atoms. Notice that the carbonyl carbon in methyl propionate lies in between two oxygens, both of which create large local negative potentials. These negative potentials offset the positive potentials created by carbon. A second important factor is atom size. Larger atoms have larger size density surfaces. This means we calculate and display potential at regions farther away from the atom. Since potential falls off as 1/r, a potential map will show smaller potentials near a large atom than it will near a small atom, other factors being equal. The effect of distance (or atom radius) on potential is dramatically illustrated by the potential maps of the halide anions (following figure, color scale = –200 to –120 kcal/mol).
All of these ions carry identical charges of –1, but the potential is most negative around the smallest anion, fluoride. As ion and map size increase, the map’s potential becomes steadily less negative. These observations, when taken together, suggest several principles that should be used when interpreting potential maps:
|