
|
|

|
Charge Distribution in Ions Electrostatic potential maps can be used to analyze charge distributions in ions. Although an ion’s Lewis structure necessarily contains a (formally) charged atom, the actual distribution of charge may be quite different. To begin, consider the potential maps of CH3– and HO– shown below (color scale = –200 to –120 kcal/mol). The Lewis structures of these ions assign a –1 formal charge to C and O, respectively. The potential maps support these charge assignments in that the most negative potentials appear near the charged atoms. Lewis structures appear to give accurate charge information for these ions.
Next, consider the potential maps of NH4+ and H3O+ shown below (color scale = +120 to +200 kcal/mol). The Lewis structures of these ions assign a +1 formal charge to N and O, respectively, but the potential maps do not support these charge assignments. According to the maps, the most positive potentials appear near the hydrogens. We must conclude that the hydrogens carry the positive charge, and the charge is spread equally over all of the hydrogens. Lewis structures do not give accurate charge information for these ions.
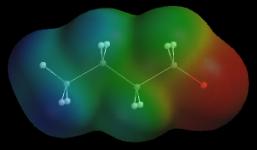
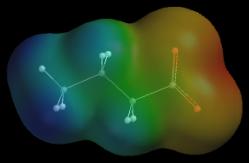
Why do Lewis structures fail to get the charges right in these cations? The answer to this in the assumption underlying formal charge assignments: bonded atoms share electrons equally. The O in H3O+ carries a +1 charge if it shares bonding electrons equally with the neighboring H. We know, however, that O is more electronegative than H (and O+ is more electronegative still), so this assumption cannot be correct. Formal charges can give the wrong picture. So far we have focused on charge location, the red region on an anion’s map and the blue region on a cation’s map. What about the other colors/regions on these maps? Does the red region near oxygen in H3O+ indicate that oxygen is negative? Before you take the bait and say, “yes, a red O must be negatively charged”, consider this: a cation repels a +1 charge no matter how the +1 charge approaches the cation. In other words, all of the regions on the potential map of H3O+ are positive regardless of color. The red color on the map corresponds to a positive potential, as do all of the other colors. We cannot guess the charges of atoms near any of these other colors. Potential maps are especially valuable tools for identifying and characterizing ionic resonance hybrids. Partial bonding in an ionic resonance hybrid can spread the ion’s charge over two or more atoms. This type of charge is known as a delocalized charge. Each charged atom carries only a portion of the delocalized charge, and these atoms create noticeably smaller “local” potentials than atoms with full charges. One way to detect delocalized charge is to compare the potential map of a suspected ionic resonance hybrid with the map of an ion whose charge is concentrated on a single atom of the same type (a charge that is concentrated on one atom is known as a localized charge). For example, we can tell if the negative charge in CH3CH2CH2C(=O)O– is delocalized by comparing the potential map of this compound with the potential map of a localized ion like CH3CH2CH2CH2O– . To make this comparison meaningful, we use the same color scale for both maps, and we compare charged atoms (oxygens) of similar size.
As you can see, the two oxygen atoms in the suspect compound produce significantly smaller negative potentials (yellow-orange) than the oxygen atom in the reference ion (red). In addition, both oxygens in the suspect compound produce similar potentials. These observations suggest that the charge in CH3CH2CH2C(=O)O– is delocalized over both oxygens:
|
||||||||||||||||||


.gif)