Repeated and Mixed Measure ANOVAs in Stata
Designs with repeated measures can be tackled in different ways depending, in part, on the complexity of the design. First lets tackle the most basic example. For this example, twelve people were given motivation tests on three different days after three different experimental manipulations. Thus the data might look like this:
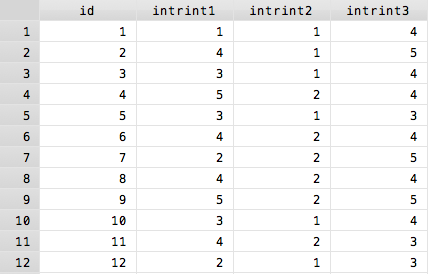
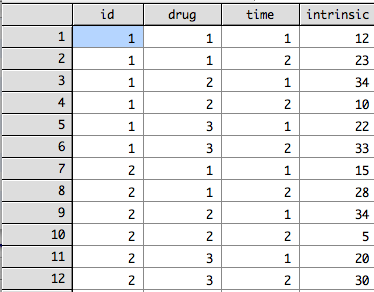
This is what is known as a wide data format, with each subject taking up one line. However, to run Stata's repeated measures commands, your data has to be in a long format. In a long format each observation of a single person is its own line, so the same data would look like this:
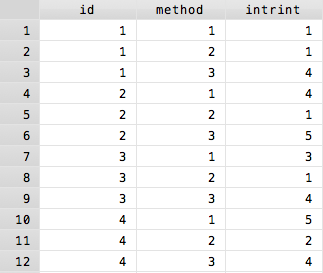
Above, only the first four participants are shown because otherwise this image would be unnecessarily long. However, the difference should be clear.
Conveniently, I moved from the first picture to the second picture via one simple Stata command, reshape. Go here to learn how to switch between long and wide data formats.
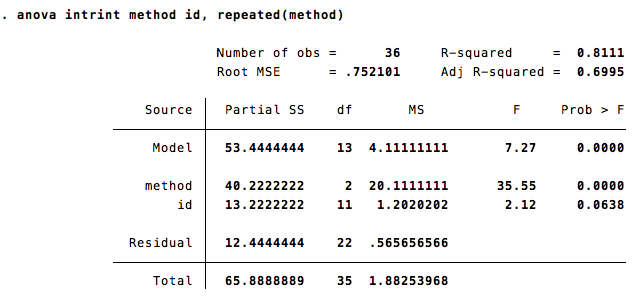
Once the data is in long format, a basic repeated-measures ANOVA is easy to run. The basic command anova [dep var] [indep var] [group var] is nearly exactly the same as in the between-subjects case, in this case anova intrint method id with the simple addition of telling Stata which variable is a repeated measure, using the repeated() option.
Putting these two things together, the final command to run a one-way repeated measures ANOVA on intrinsic motivation would look like this:
anova intrint method id, repeated(method)
If you forget to include the unique subject identifier (in this case id) in the main anova command, Stata will ask you to specify a between-subjects error term.
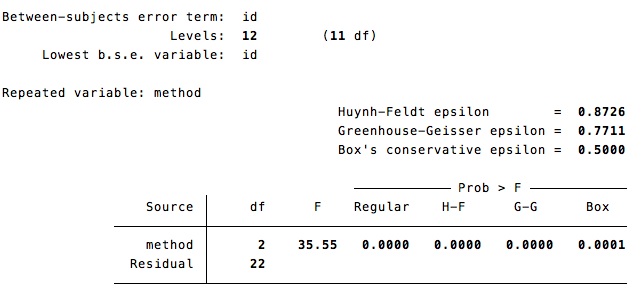
Assuming everything was properly inputted, the output occurs in two parts. First is the standard ANOVA output. In addition to the variable of interest, method, there is a line of output for your identifying variable. This can be ignored as it is not valid in most repeated measure designs.
Following this initial output is a series of epsilons which represent various ways of correcting for violations of the sphericity assumption that underlies the repeated measure ANOVA. These epsilons represent corrected degrees of freedom according to a wide variety of formulas with Box's conservative epsilon being the most conservative and Huynh-Feldt epsilon being the least conservative. Stata requires you to make these degree of freedom adjustments yourself except in the case of Box which provides the p-value after applying the Box's conservative epsilon correction. If this p is significant, then there is no reason to examine the other epsilons.
To add between-subject factors simply put them into the ANOVA equation.
In addition to this built-in method, there is the user-created command wsanova which does things slightly differently but is the preferred method for doing mixed-measure models because it is quite a bit simpler.
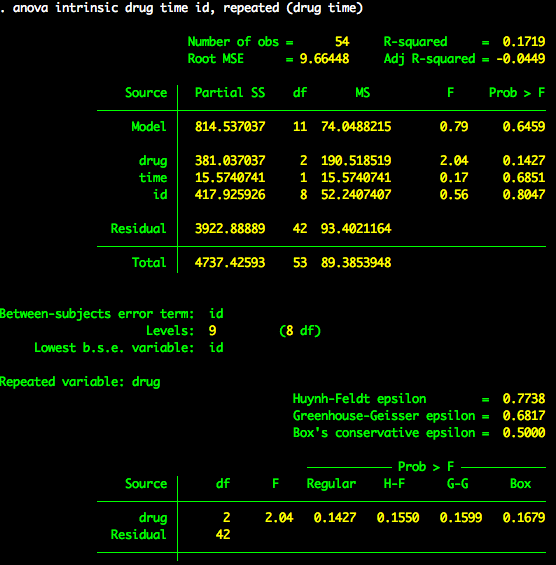
Now, lets try an example of a 2X2 repeated measures ANOVA. Lets say I have nine subjects who each took three drugs on which they took three tests of intrinsic motivation (at different times). First, a snapshot of how Stata wants the data to look, as before, this example only shows the first two participants as showing all of them would create a very long image.
The proper way to run this 2X2 beween-subjects ANOVA is anova intrinsic drug time id, repeated (drug time) and yields the following output. This image truncates before showing the sphericity corrections for the time variable.